You are here
S4 - Codima Spider - Network Inventory, Map, Performance and Application Monitoring System
Codima Spider is a powerful Web-enabled Network Inventory, Map, Performance Monitoring and Application Monitoring tool. It automatically gathers inventory information, maps the network and, without any user intervention, starts to monitor the important interfaces and devices on the network to automatically produce Alert Reports showing the historical trends associated with network problems. It also combines comprehensive network asset reports and topology drawings with highly customizable real time dashboard displays.
Long term Performance Monitoring and Application Monitoring
Codima Spider monitors an extensive range of critical performance metrics for the Interfaces, Devices and Applications on your network, this includes monitoring:-.
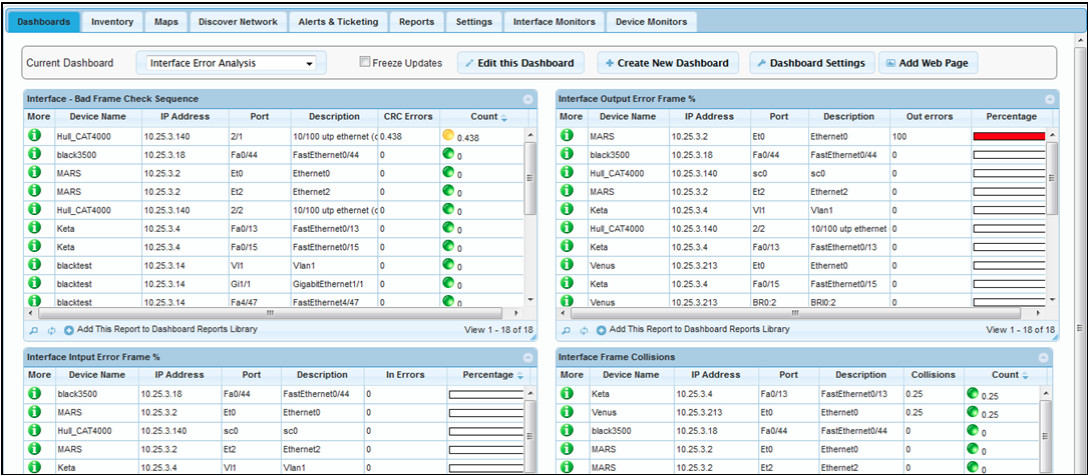
Interface Errors, Loading and Real time status
Availability and Response times for Devices and Services
Web page availability, associated Response times and error reports
CPU, Memory and Disk usage
Citrix, Sharepoint, IIS, Active Directory, SQL Server, Printing, Exchange
Dashboards rapidly show the worst performing Interfaces, Devices and Applications on the network and provide direct access to Device Information and long term trend graphs used for in-depth analysis.
Daily, Weekly and Monthly Trend Reports
Codima Spider has a fully customizable statistical report facility with a library of pre defined dynamically populated reports and a wide range of templates to create more Daily, Weekly & Monthly reports covering Performance and Application Monitoring results. It also automatically provides Alert Reports that draw the users attention to issues on the network and show :-
Todays Alerts in relation to traffic trends
Alerts in relation to traffic trends for past time periods
Automated Network Discovery
Codima Spider saves Time and Resources through automation. Using the automated discovery facility is much more efficient than gathering information for the inventory and maps manually, the information comes directly from the devices.
Real Time Maps
The Live Web Maps are automatically laid out following the discovery and highlight network problems in real time. Showing the links that have the most traffic and the devices that are overloaded or unavailable. NetFlows can be visualized in the Map, which also provides Playback and Animation features.
Asset Inventory with Search and Data Mining facilities
The Asset Inventory can be accessed to obtain highly detailed and up-to-date information. The sophisticated search facility and Data-mining facilities can then be used to easily locate device/component specific information and produce instant custom reports. For example find specific software patches or a particular interface type.
Alert and Trouble Ticketing System
Codima Spider has a built in Trouble Ticketing facility that can be used to assign Alerts to nominated Engineers with tracking reports and tagged assignment and solution notes. It has an embedded email client to ensure independence from the Network’s own email facilities, enabling any failures associated with the platform hosting the Networks email client to be reported.
Predefined Monitor Templates
The Monitor Templates used for Performance Monitoring and Application Monitoring make it easy to :-
Use ICMP Pings to check device operation and measure device response times
Use SNMP to poll Interfaces and devices and to monitor device specific performance parameters
Use TCP Pings to check if service is running on a specified port and measure service response times.
Use URI Tracking to check if Web pages are being served, measure associated response times, Page Validity and the type of response
Use WMI to gather a wide range of performance information from Microsoft Servers.
NetFlow Support
Codima Spider supports the following versions of NetFlow
NetFlow Version 5
NetFlow Version 9 (Flexible NetFlow)
NetFlow Version 10 (IPFIX)
Software Analysis - Black and White Lists
Codima Spider provides facilities to :-
Operate Black Lists – to check if selected devices are running unauthorised processes/services
Operate White Lists – to check if selected devices are running essential processes/services
Enterprise Level Remote Monitoring with Multi-User Access
Codima Spider has multi-user, multi-platform access, with login based access rights to features. Users can control operations and view all reports, graphs and maps from a wide range of platforms including portable devices such as iPADs. The Users would typically browse a Codima Spider Host Platform (which runs on Microsoft® XP, Vista, Windows 7 or Windows 2008 Server). The Spider Application is automatically loaded on start up. The Codi-ma Spider can also operate as an Enterprise level Management system. The involves the deployment of Spider Probes. The moni-toring system is scalable - Probes can easily be added as the net-work grows.
Easy to Install and Get Started
A simple step by step installation process includes automatic setup and configuration of the MySQL database used to store information. The unique single focus Spider Assist facility leads you through the process of running a network discovery and setting up network polling to monitor Devices and Applications. Ensuring that you quickly get the benefit of the Spiders comprehensive network inventory, mapping and monitoring facilities.