You are here
S2 - Truview Application Performance management and End User Experience monitoring
Application Performance Management and End User Experience Monitoring
Problems can occur anywhere from the physical layer to wireless, across the WAN, through the core and into the data centre. The application delivery infrastructure is a highly interdependent eco-system and with no visibility into how this entire system is performing as a single entity, resulting in organizations being faced with high costs in network downtime, lost revenues and poor performance in terms of fast problem identification.
IT support teams are typically siloed using their tool of choice but this presents a challenge in that these disparate toolsets provide no correlated view into performance issues that may be present within any component across the application delivery infrastructure. Without the ability to understand how one component may be affecting another at a specific point in time, it becomes difficult, if not impossible, to quickly understand how well the infrastructure is transporting applications, how well those applications are performing, and where the problem truly lies.
TruView is a unified solution for Application-aware Network Performance Management. TruView embeds the most important data sources such as packet, transaction, NetFlow/IPFIX, and SNMP and presents analytics in a time correlated single dashboard view. These correlated views will help you to quickly see how well the infrastructure is transporting applications and how well those applications are performing in context of the end user’s experience. And, TruView’s integrated 10 Gbps full line rate stream-to-disk packet capture ensures you’ll never miss an important event again, as verified by the Tolly Group independent performance test.
TruView can be deployed as an individual appliance or as part of a distributed configuration for larger environments. TruView appliances offer a new level of functional flexibility, allowing them to be deployed in optimized configurations for packet monitoring, flow collection, or both.
TruView Recognized by Leading Analyst Firms
Ranked as a leader in Gartner’s NPMD Magic Quadrant and Best Hybrid ANPM Solution in Enterprise Management Associate’s Radar Report, Visual TruView is leading the way in a new, emerging method of monitoring, troubleshooting, and analyzing both network and application systems commonly referred to as Application Aware Network Performance Management (AANPM). AANPM takes data from both APM and NPM to create cross-platform visibility that enables all branches of IT
AUTOMATED NETWORK DISCOVERY & PATH ANALYSIS
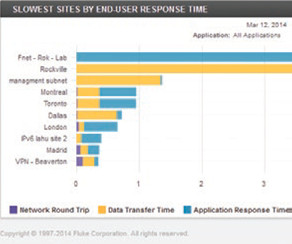
TruView users gain the ability to track the path between end user and server as well as the health of devices along that path. When TruView identifies a network response time issue, path analysis is leveraged to identify the Layer 2 and Layer 3 path taken by end users, with visibility into the utilization, errors and discards along that path.
END USER EXPERIENCE
TruView tracks the performance of individual users. It’s as simple as typing in their username, be it Active Directory, DNS, NetBIOS name IP Address or VoIP endpoint or phone number, and TruView will provide usage, performance and event information focused on that single user as compared to others at the same site.
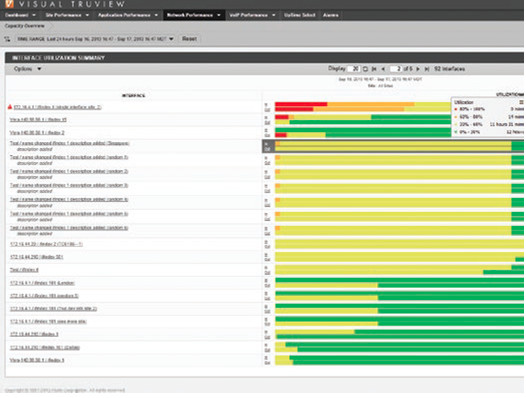
PLANNING
WAN utilization and traffic profiling has never been easier than with Review’s automated Capacity Planning reporting engine. Just filter on the network interfaces of interest and TruView provides you with easy to understand views of how long, or not, any given interface has been over or under-utilized. The utilization information is based upon 60 second granularity across an entire year assuring you of an accurate depiction of network utilization, leading to more informed infrastructure investments.
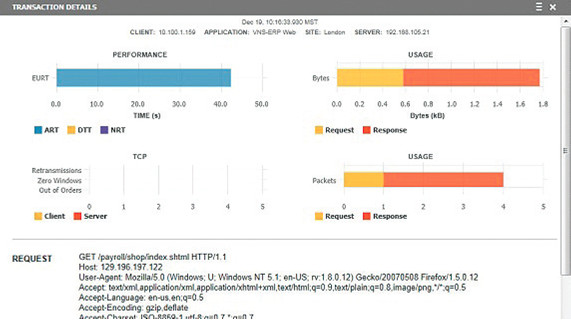
ADVANCED TRANSACTION ANALYSIS
Built-in application transaction analyzers provides out of the box support for Web, Citrix, SQL, Oracle, CIFS, XML and more with no additional modules to buy. TruView provides the most granular view of performance allowing you to visualize every transaction and their N-Tier dependencies to help you understand what tier is affecting application performance.
UNIFIED COMMUNICATIONS
Gain one of a kind visibility into VoIP quality of experience with an easy to understand graphical depiction of the call, with drill down to understand the underlying degradation factors. TruView quickly identifies degradation factors such as Jitter, packet loss, latency, etc...
SINGLE UI
Whether you leverage TruView as a single appliance that embeds five tools in one or deploy as a highly scalable distributed system, time correlated analytics across data sources displays in a standardized UI. Highly customizable dashboard views provide self-guided workflows patterned after a logical troubleshooting process making problem domain isolation and root cause identification possible in just 3 clicks!